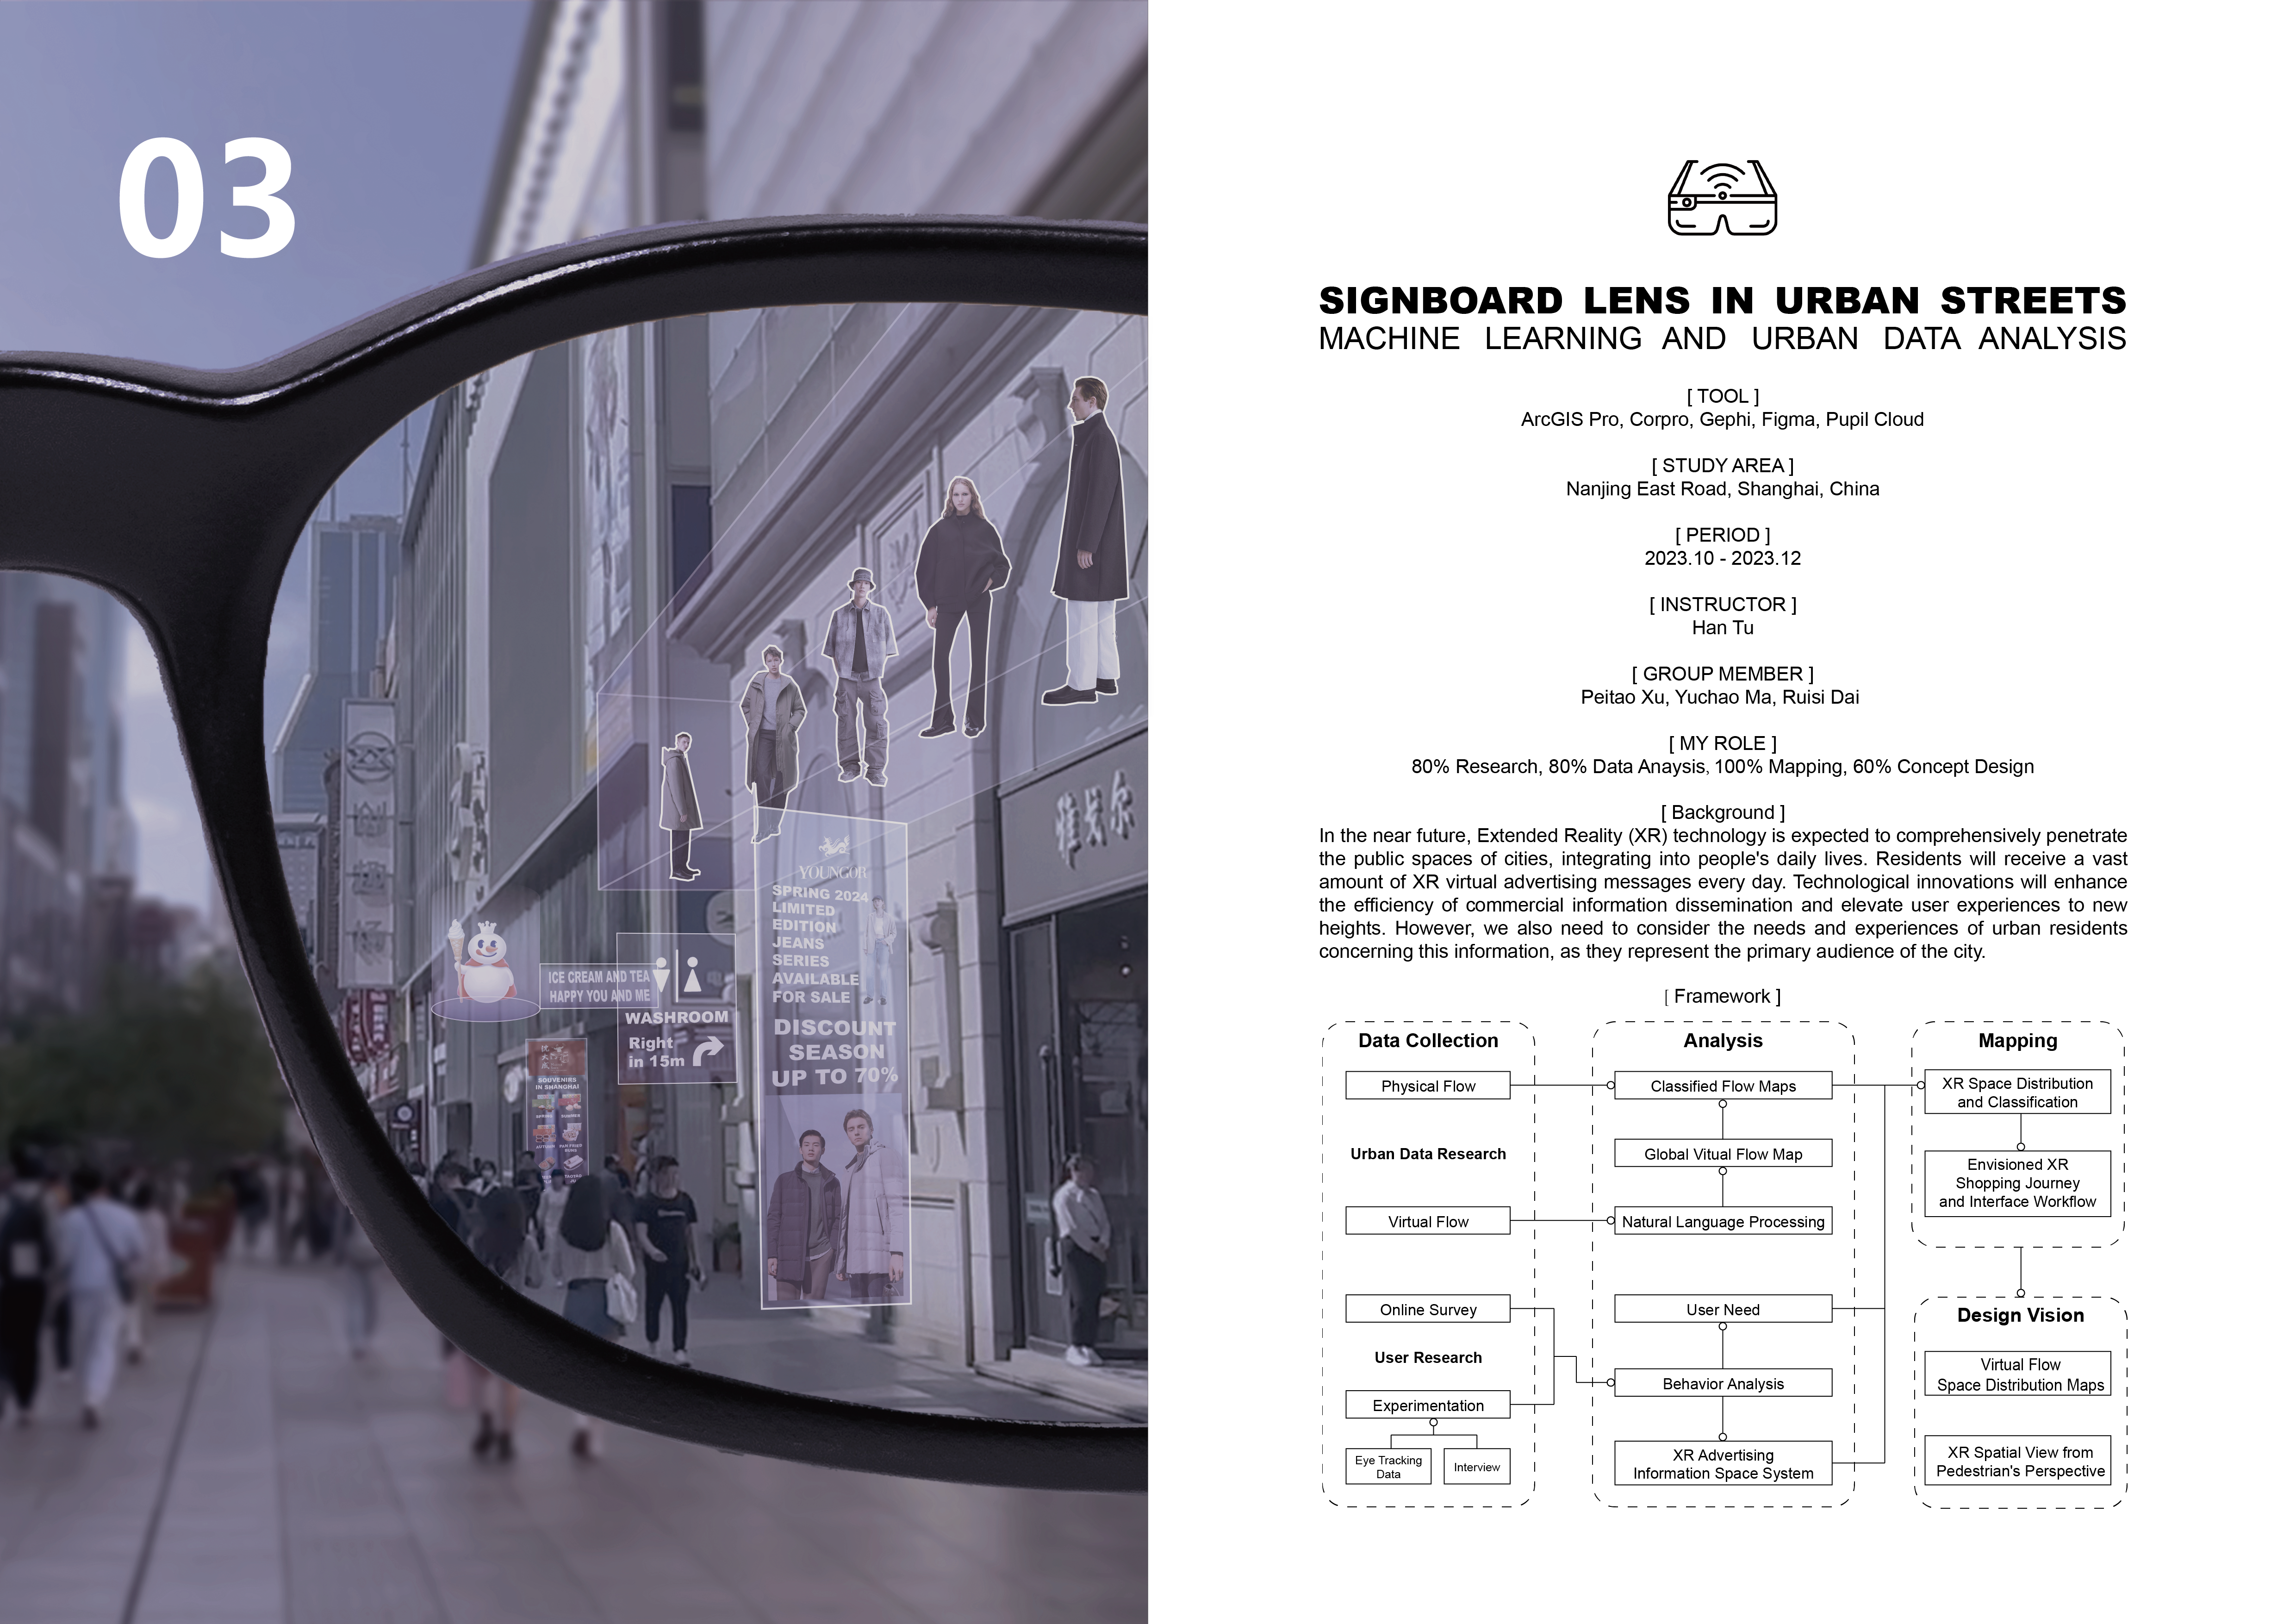
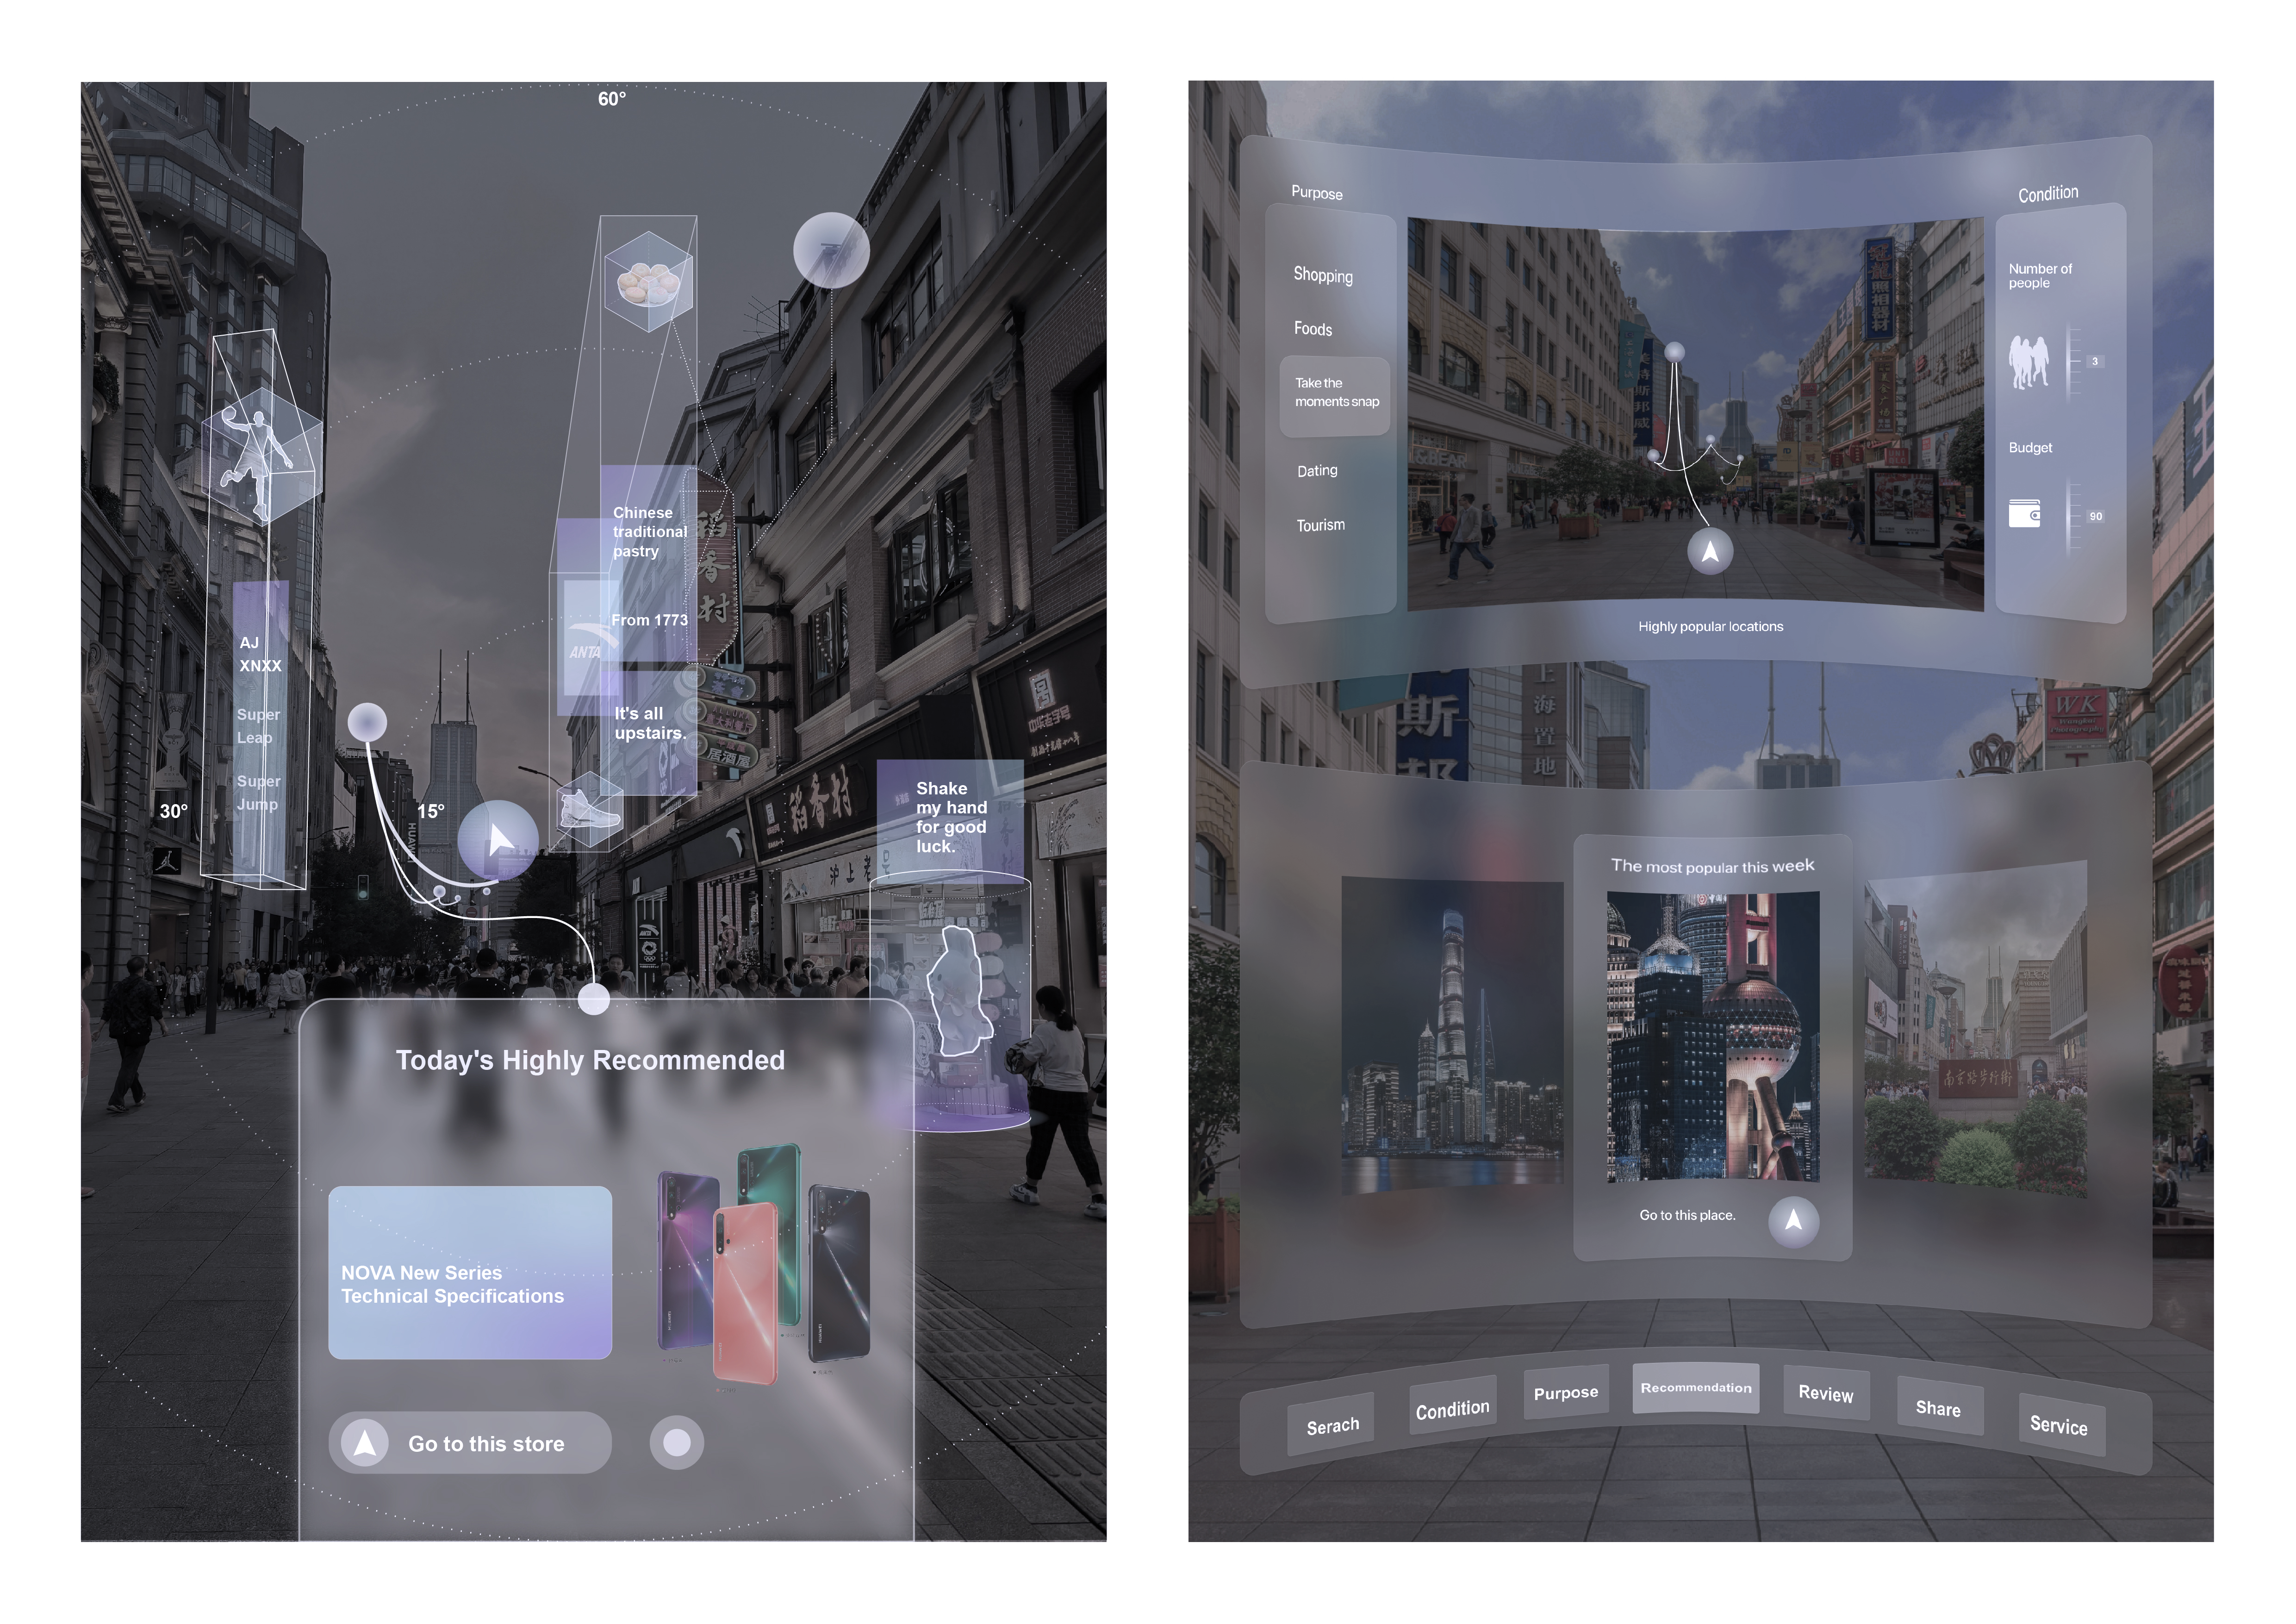
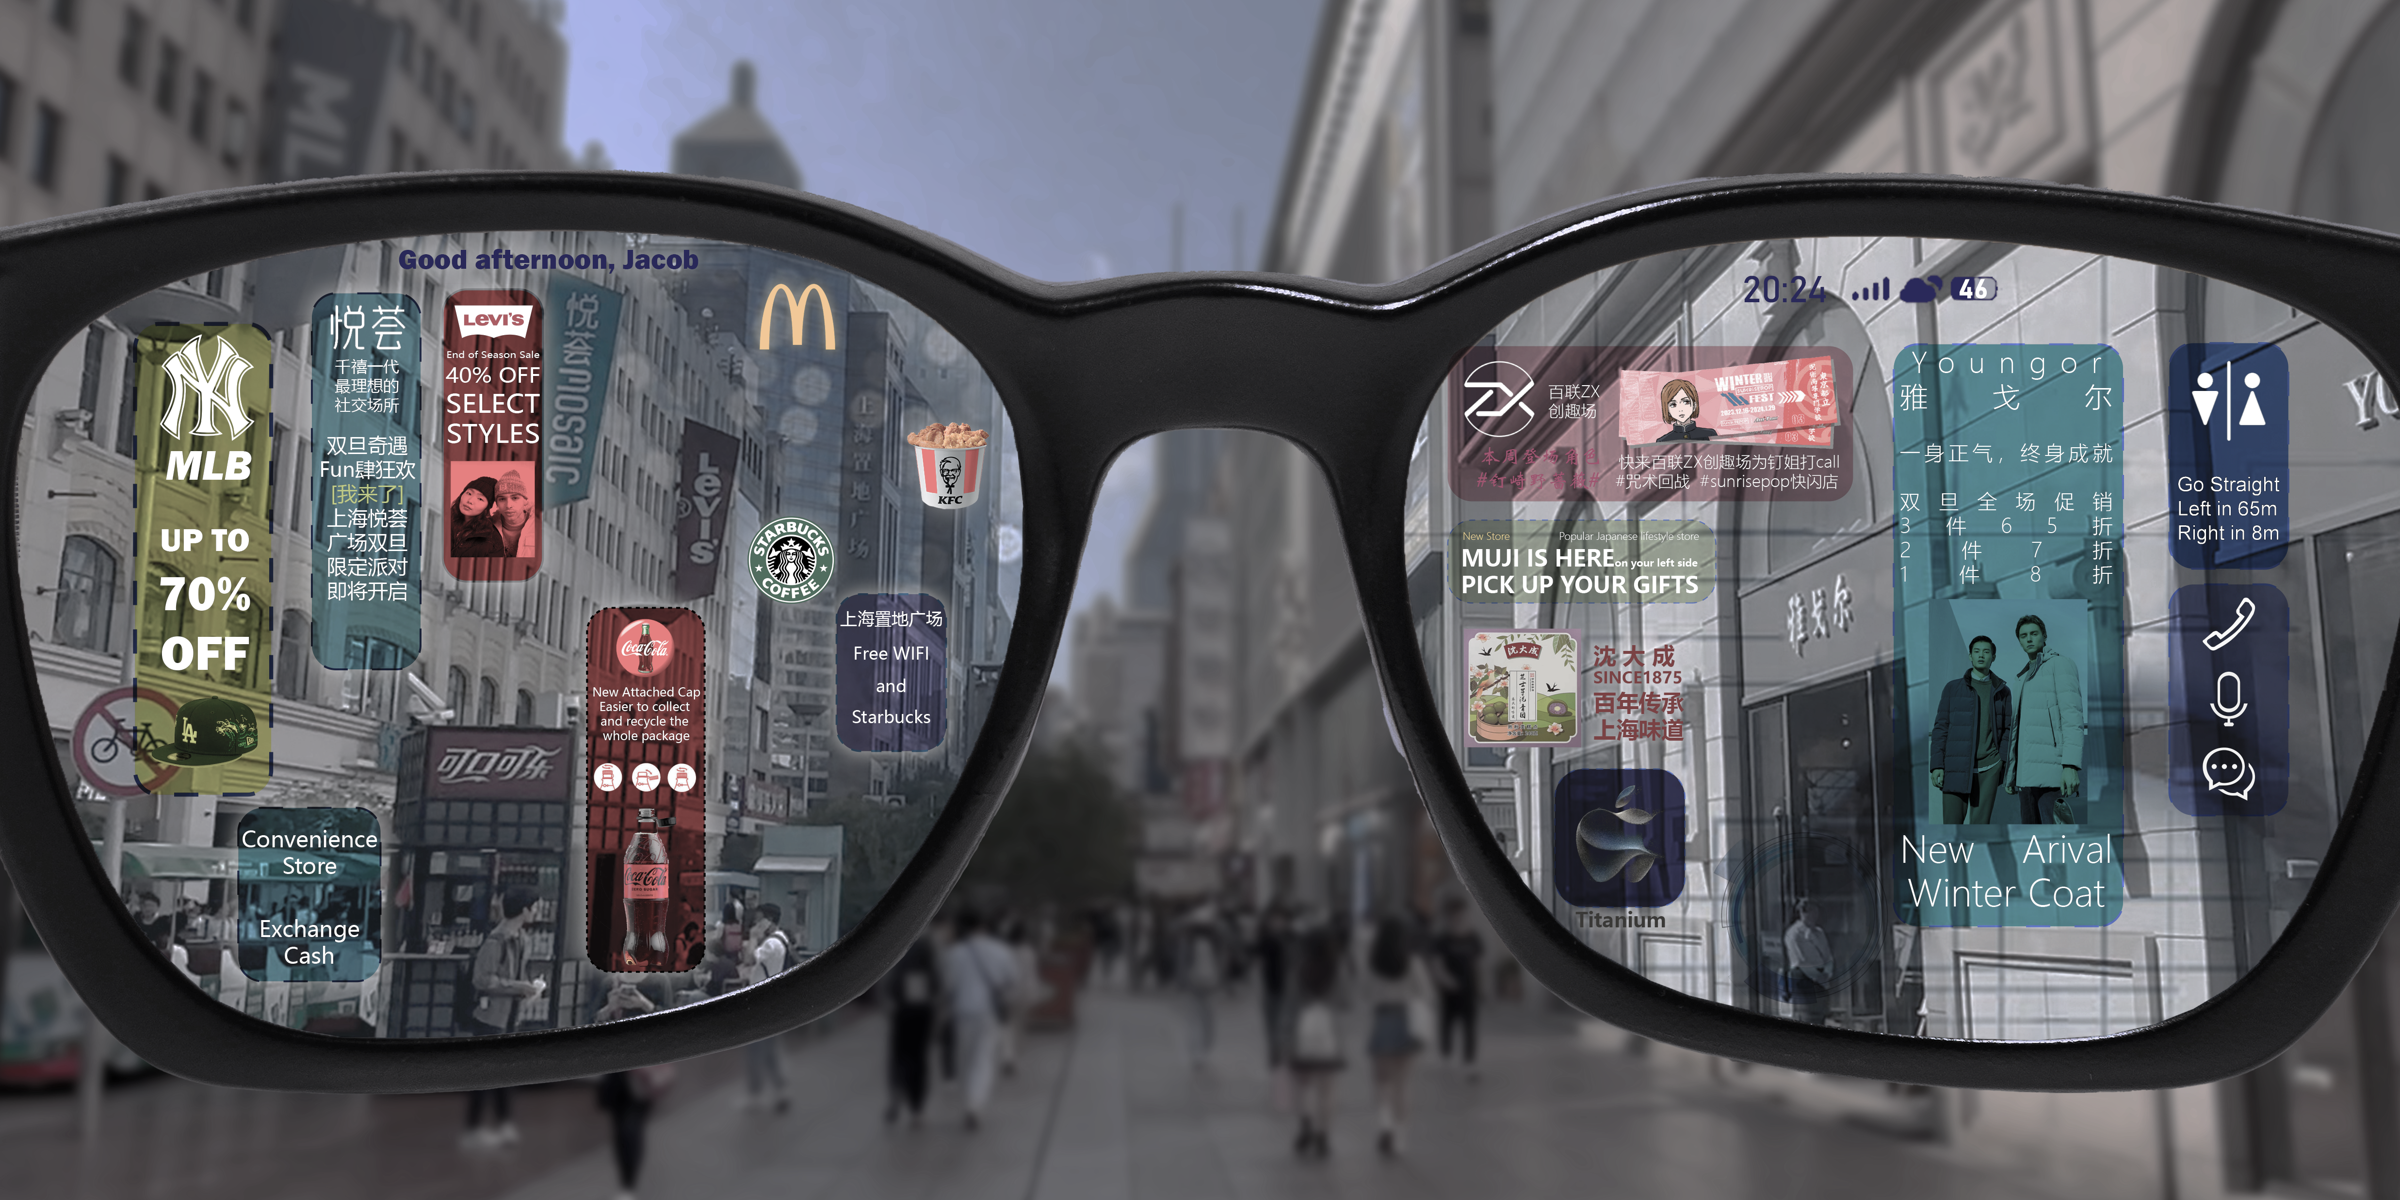
Signboard Lens in Urban Streets
Analyzed urban signboard distribution and its correlation with social activities using GIS and machine learning.
Brief
Year: 2023
Location: Shanghai, China
Client: Lab T+
Tool: ArcGIS Pro, Python, Corpro, Gephi, Figma,
Pupil cloud, Adobe Illustrator, Photoshop
Background
Signboards play a crucial role in shaping urban landscapes, influencing navigation, commercial activity, and visual
aesthetics. However, excessive signage can lead to visual clutter, affecting pedestrian flow and the overall streetscape
experience. This project explored the spatial distribution of urban signboards and their interaction with human activities
to inform smarter urban planning strategies.
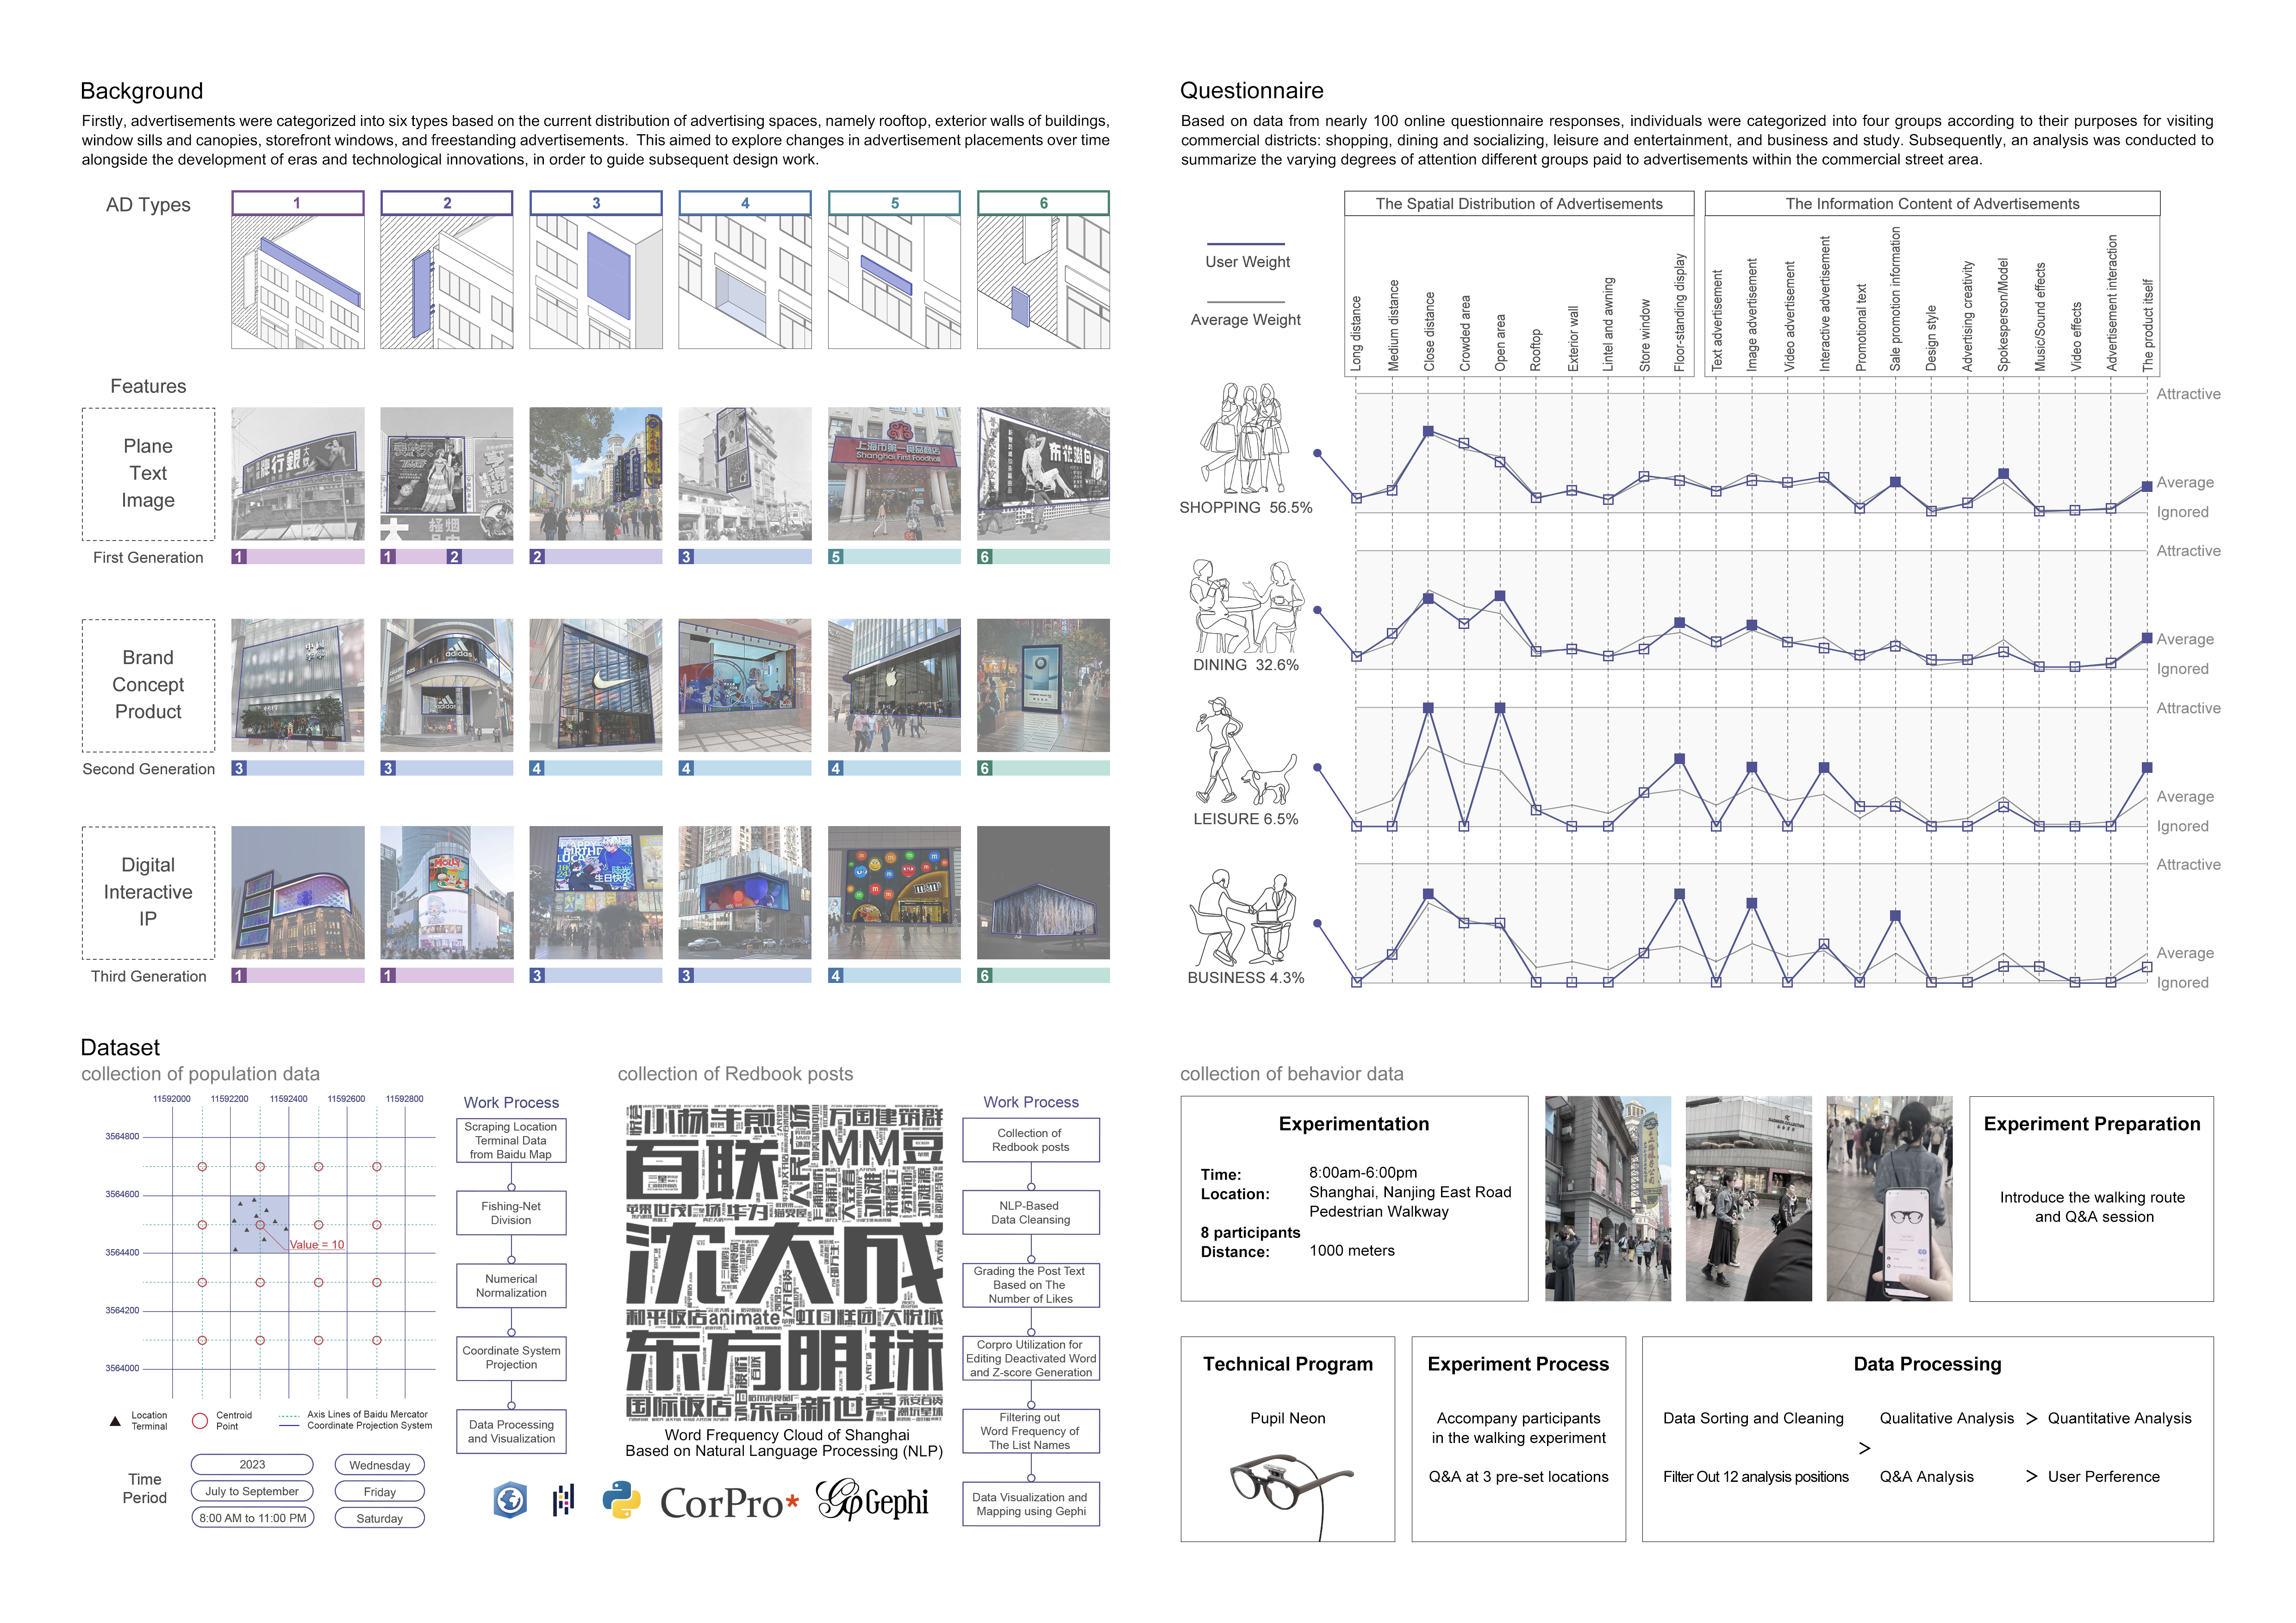
Introduction
Leading a team of three, we developed a data-driven methodology to analyze the impact of signboards in Shanghai’s
urban environment. The project involved:
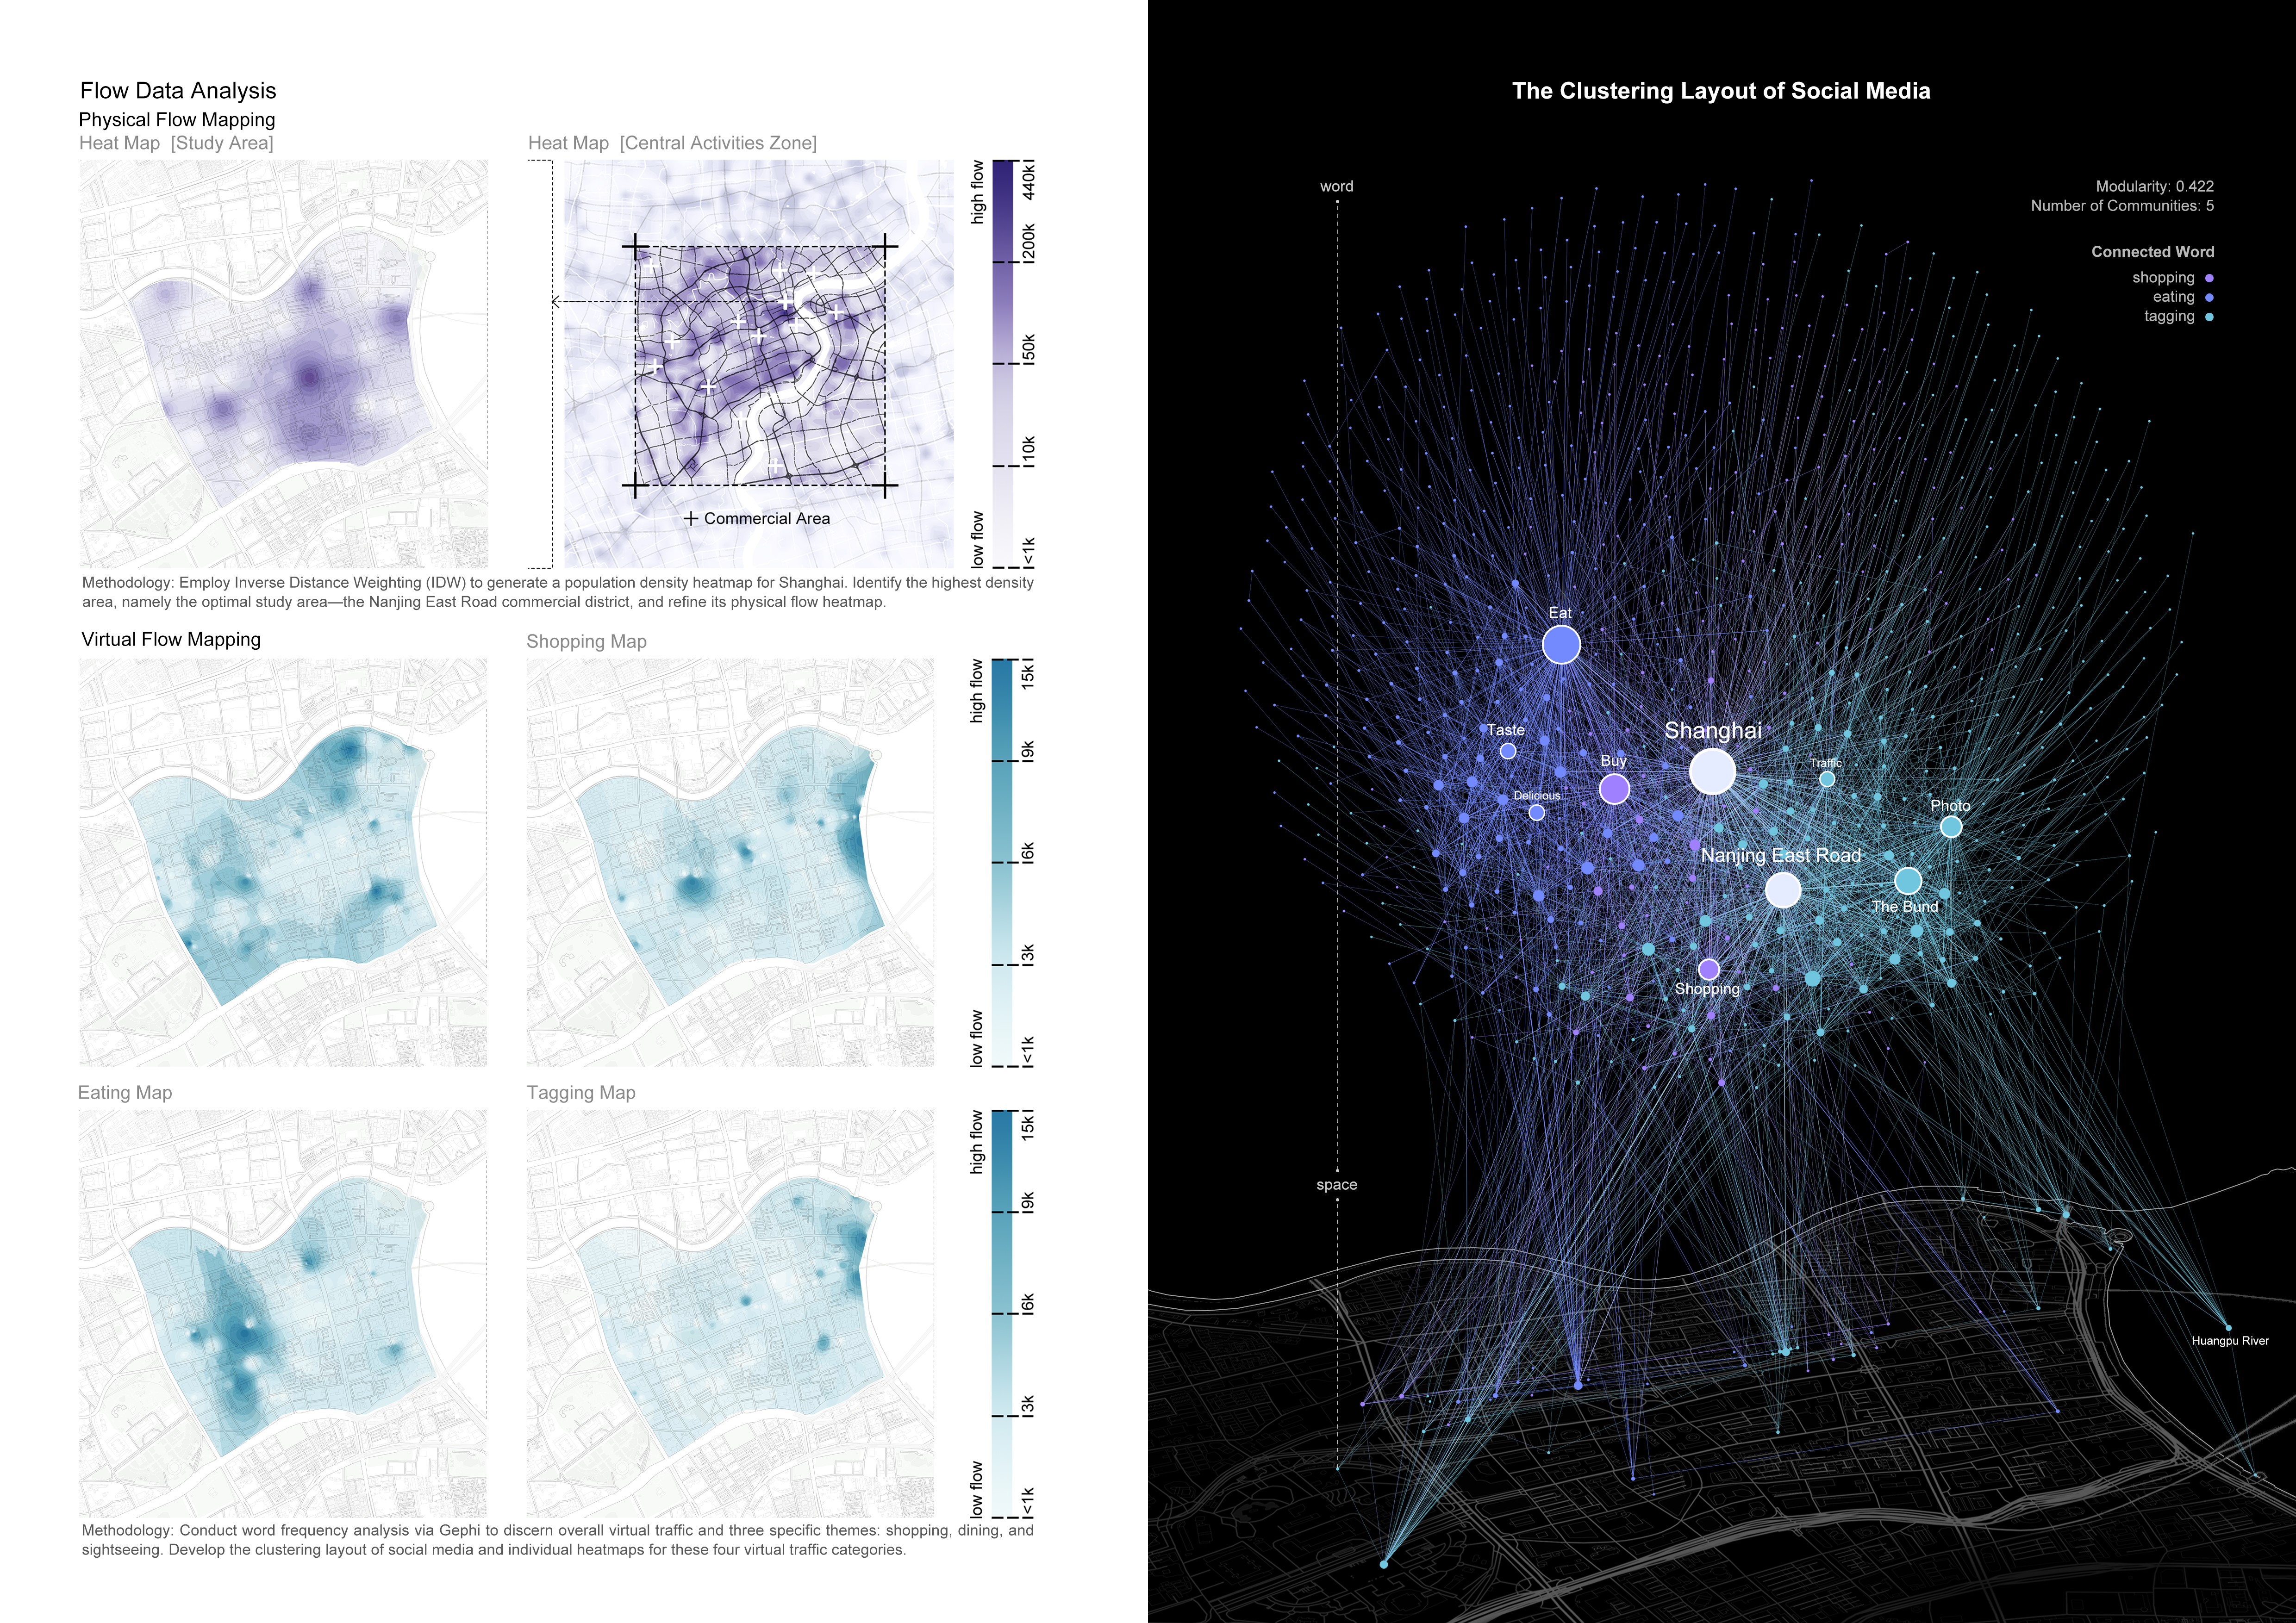
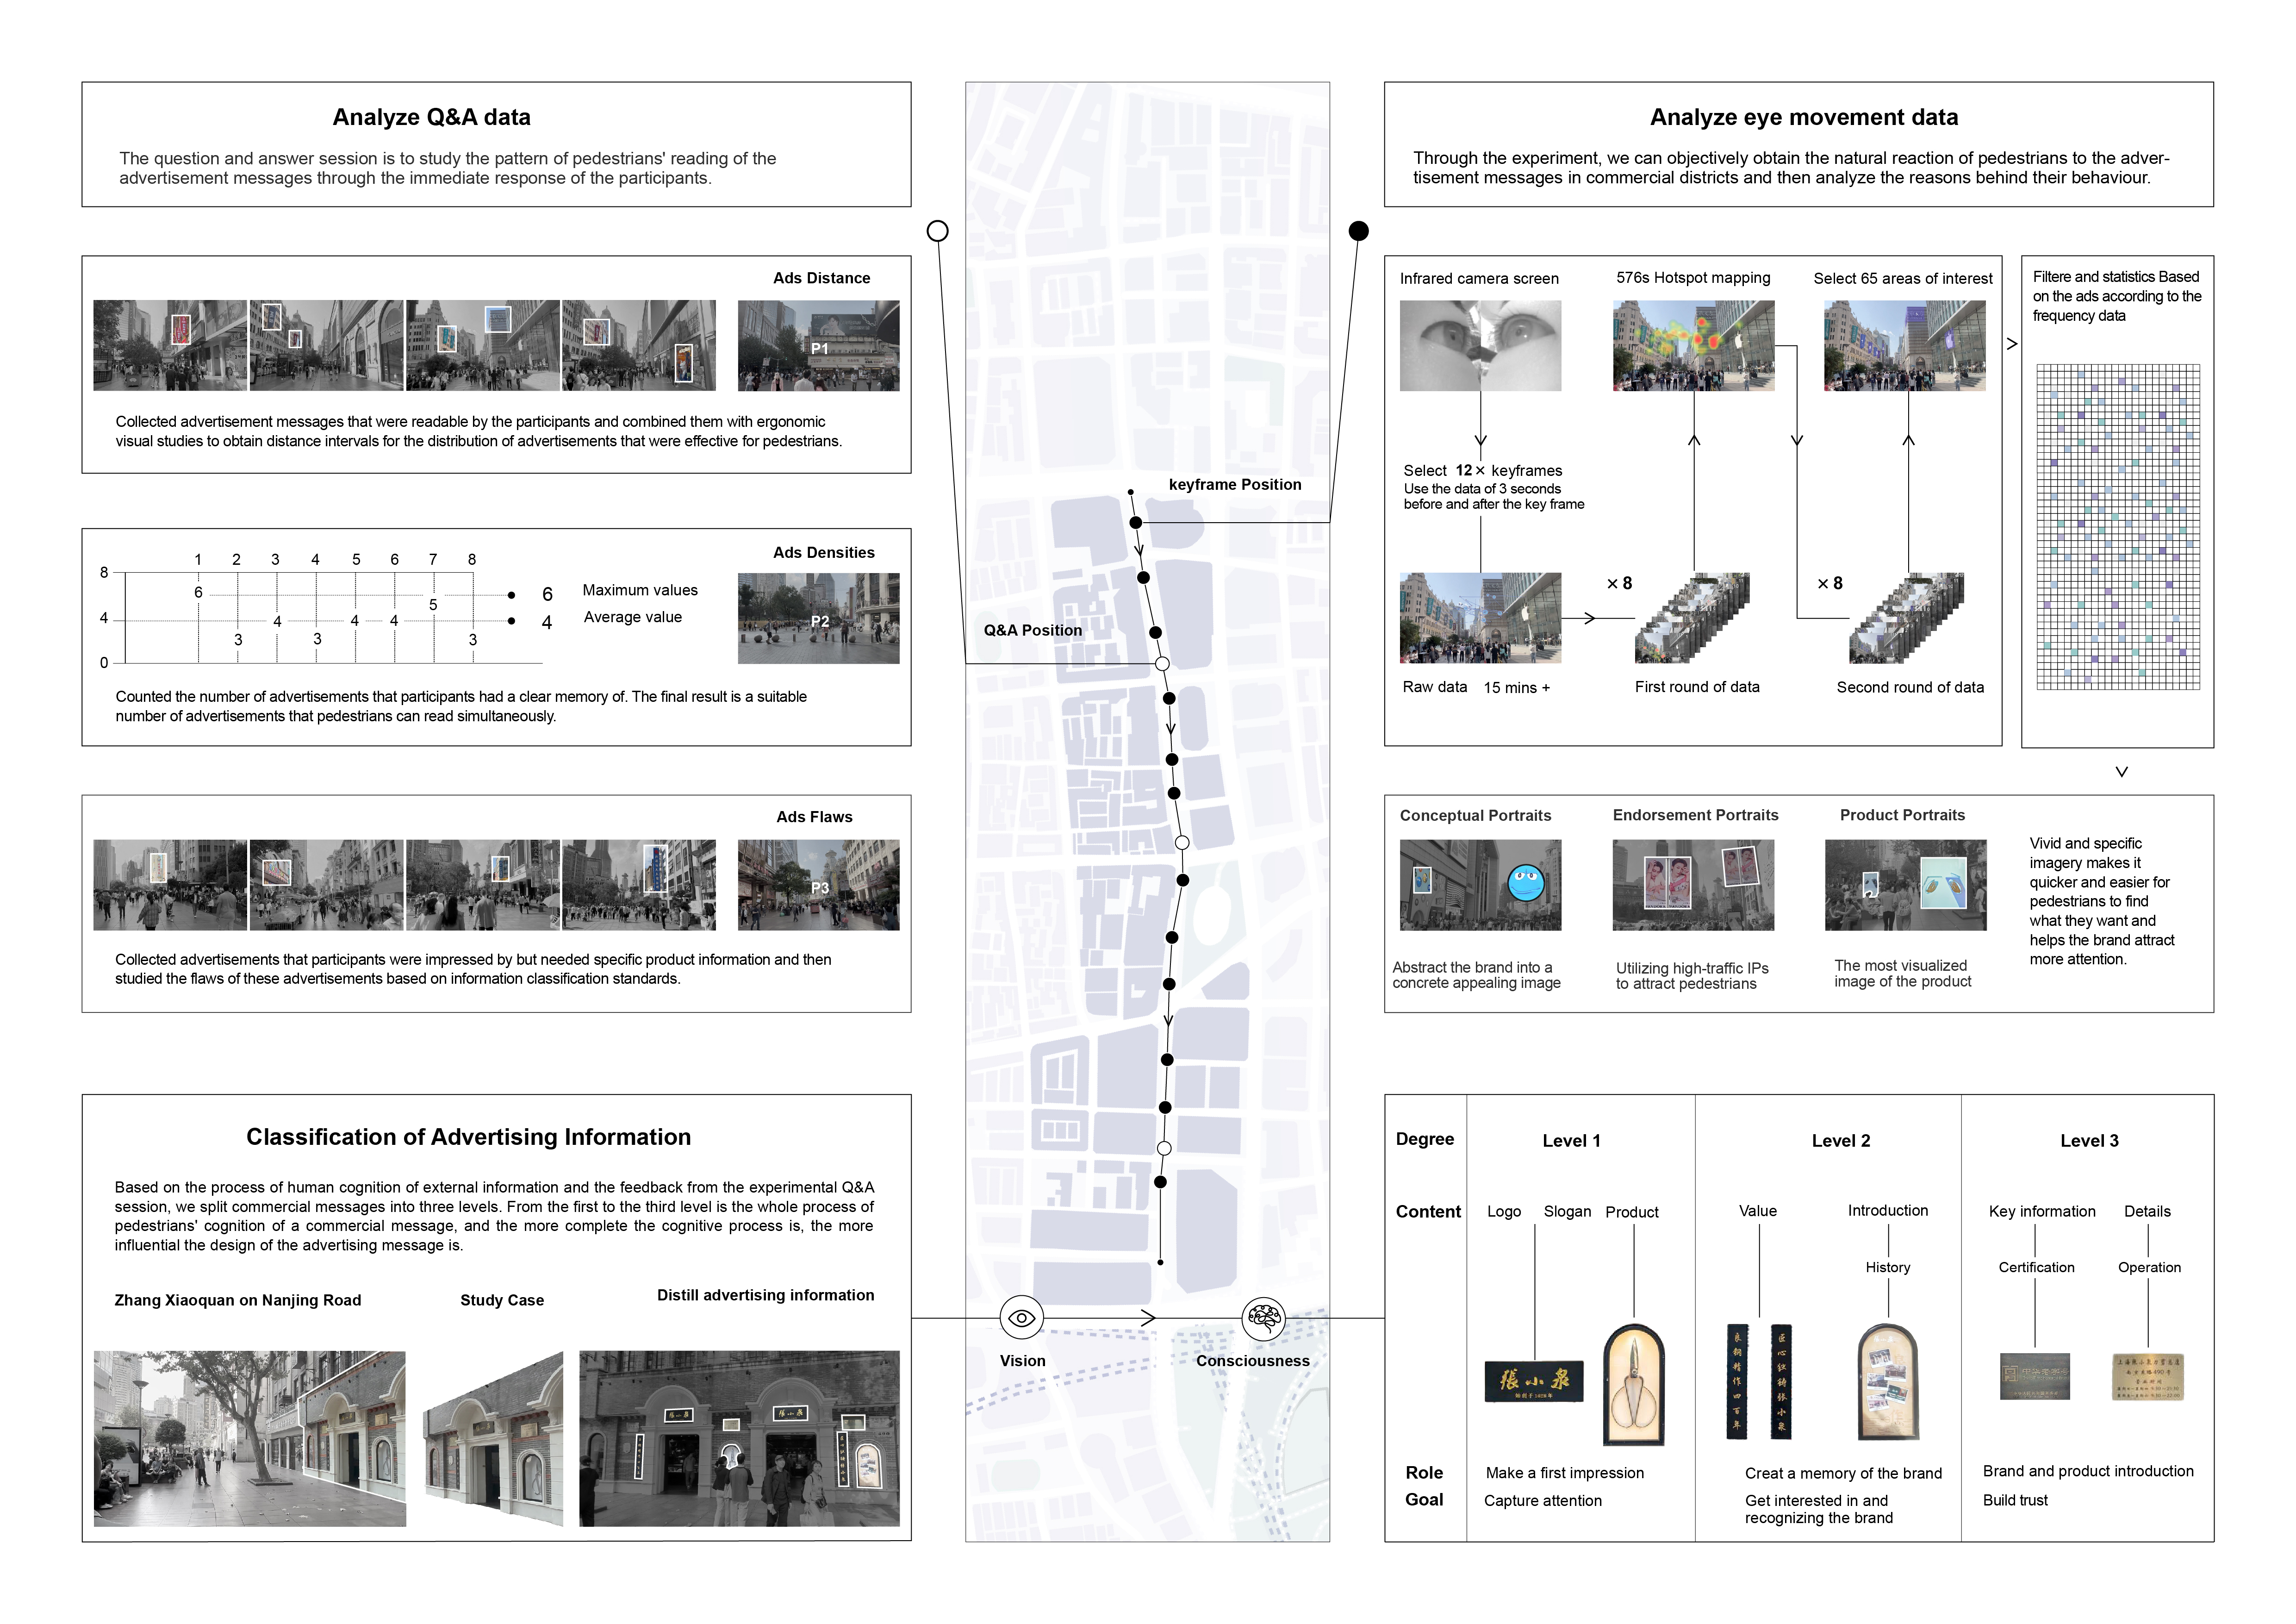
o Data Collection & Analysis: Integrated geospatial data, POI data, physical movement patterns, and social media data.
o Machine Learning & NLP: Built a model to analyze correlations between signboards, social activities, and human flow,
leveraging natural language clustering.
o GIS Visualization & Urban Design: Created heat maps and spatial analysis models to visualize signboard density and its
effect on public spaces.
o XR & Smart City Insights: The findings contributed to digital signage optimization and informed XR-based urban planning
strategies.